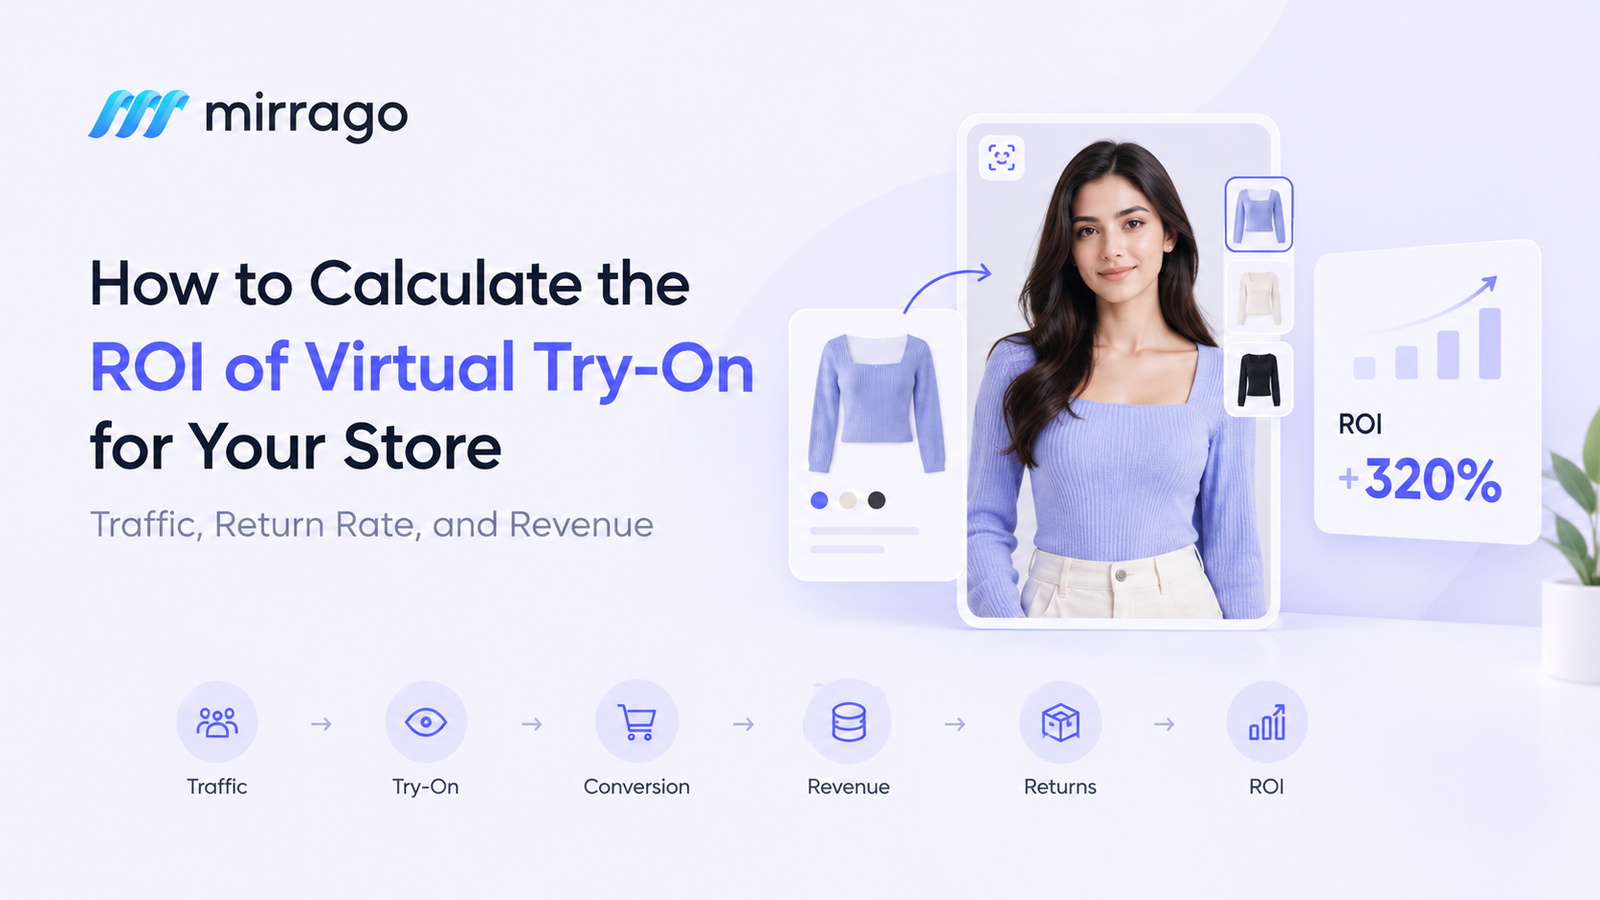
How to Calculate the ROI of Virtual Try-On for Your Store: Traffic, Return Rate, and Revenue
You already invest money to bring shoppers to your website. Ads, SEO, email campaigns. it all adds up. But traffic alone doesn’t generate revenue. A shopper can land on a product page, hesitate because they can’t picture how an item will look on them, and leave without buying.
And even when a shopper does place an order, the revenue isn’t necessarily secure. In fashion e-commerce, a sale isn’t truly final until the return window closes. Every “it doesn’t look right on me” return can quietly reduce the margin you worked hard to earn.
That’s why virtual try-on ROI is a more useful question than simply asking whether the feature is “worth it.” Instead of relying on assumptions, you can measure its financial impact.
The real question is how virtual try-on changes your traffic, conversion rate, revenue, and return rate, and whether the resulting financial benefit justifies the cost of implementing it. This article shows you how to calculate that impact using practical formulas and a worked example.
What Does Virtual Try-On ROI Mean for an Online Store?
ROI = Return on Investment. Simply put, it is a process of comparing the input and output of something.
For a fashion store, virtual try-on ROI isn't just about how many people click the try-it-on button. It's about what that click leads to. Specifically, it's measured through:
Your existing website traffic
How shoppers engage with the try-on feature
Whether conversion rate actually improves
The revenue that improvement generates
Changes in your return rate
What the technology costs you to run
The Basic Virtual Try-On ROI Formula
The foundational formula is simple:
ROI = (Gain from Investment − Cost of Investment) ÷ Cost of Investment × 100
The key point people often miss is how to measure the gain. It shouldn’t simply be the number of shoppers who used the try-on tool. What really matters are measurable business results: more orders, higher retained revenue, and fewer costly returns.
Start With Your Store's Current Traffic and Conversion Rate
Before you can measure the impact of virtual try-on, you need a baseline. Without one, you're just guessing at what changed.
It's worth noting that the average online cart abandonment rate sits around 70%, so even small improvements in conversion can compound quickly across a large traffic base.
Pull these numbers from your analytics before you implement, or before you evaluate, virtual try-on:
Monthly website traffic
Product-page traffic specifically
Current conversion rate
Add-to-cart rate
Average order value (AOV)
Calculate Your Current Revenue From Traffic
Two simple formulas get you there:
Orders = Traffic × Conversion Rate
Revenue = Orders × Average Order Value
For example:
50,000 visitors × 2% conversion = 1,000 orders
1,000 orders × $80 AOV = $80,000 revenue
Here's an important point worth remembering: virtual try-on doesn't necessarily need to bring in more visitors to create value. Its job is to help you convert more of the traffic you're already paying for.
Measure How Virtual Try-On Affects Your Revenue
Once you have a baseline, you can assess how much things change once shoppers begin testing virtual try-on.
Compare Conversion Before and After Virtual Try-On
Before virtual try-on: 50,000 visitors × 2% = 1,000 orders
After virtual try-on: 50,000 visitors × 2.4% = 1,200 orders
That's 200 additional orders. At an $80 AOV, that's
200 × $80 = $16,000 in additional gross revenue
This is a hypothetical calculation, not a guaranteed outcome. Each store's numbers will be different. It's important to look at the same metrics in parallel: conversion rate, number of orders, revenue per visitor, add-to-cart rate, and AOV. That comparison is the core of any virtual try-on ROI calculation.
Calculate the Impact of Virtual Try-On on Return Rate
Revenue is only half the story. A completed sale that comes back a week later as a return isn't really a win; it's a cost with extra steps.
Returns are a bigger problem than most stores realize. U.S. retailers are projected to see nearly $850 billion in merchandise returned in 2025 alone, which is why even small percentage-point improvements matter at scale.
Calculate Your Current Return Rate
Returned Orders = Total Orders × Return Rate
For example, 1,000 orders at a 20% return rate gives you 200 returned orders.
It's also worth figuring out your average cost per return, which usually includes:
Return shipping
Processing time
Restocking
Customer support handling
Reverse logistics
Compare Return Rate After Virtual Try-On
When you implement virtual try-on, say your return rate drops from 20% to 17%. When you implement virtual try-on, you might find a drop in return rate from 20% to 17%. This is an actual 3% gain.
But don't judge the result by the percentage alone. If your total order volume grows significantly, the actual number of returned orders might not fall much, or could even tick up slightly. That's why a proper virtual try-on ROI calculation weighs conversion growth and return-related costs together, not one in isolation.
A Complete Virtual Try-On ROI Example
Let's put the pieces together with one full example.
Metric | Before VTO | After VTO |
Monthly traffic | 50,000 | 55,000 |
Conversion rate | 2.0% | 2.4% |
Orders | 1,000 | 1,200 |
AOV | $80 | $80 |
Return rate | 20% | 17% |
What Changed?
Revenue before: 1,000 × $80 = $80,000
Revenue after: 1,200 × $80 = $96,000
Potential revenue increase: $16,000
What Happened to Returns?
Returns before: 1,000 × 20% = 200 returns
Returns after: 1,200 × 17% = 204 returns
The return rate genuinely improved, but the number of returned orders barely moved, because there were simply more orders overall.
This is a useful, slightly counterintuitive insight. Measuring virtual try-on ROI means looking at the full picture, not fixating on one percentage.
From here, factor in the additional profit from those extra sales and the savings from avoided return costs, then weigh both against what the technology costs to run.
Calculate the Overall ROI of Virtual Try-On
Now bring the pieces together into one number.
Calculate the Financial Gain
Total Gain = Additional Profit + Return Cost Savings
Net Gain = Total Gain − VTO Cost
ROI = Net Gain ÷ VTO Cost × 100
Gross revenue shouldn't be mistaken for profit. If your store generates $16,000 in additional revenue but only keeps a portion of it after product costs, shipping, and discounts, that retained contribution margin is what belongs in a realistic virtual try-on ROI calculation, not the top-line figure.
This is also where a solution like Mirrago fits into the picture. As a virtual try-on tool built for fashion e-commerce, its value should be judged the same way: by the conversion lift, revenue retained, and return costs avoided, weighed fairly against what it costs to run, not by unsupported promises.
What Metrics Should You Track After Adding Virtual Try-On?
Keep an eye on two groups of numbers.
Traffic & Revenue Metrics
Website traffic
Product-page traffic
Conversion rate
Add-to-cart rate
Average order value
Revenue per visitor
Try-On & Return Metrics
Try-on usage rate
Try-on-to-cart rate
Try-on-to-purchase rate
Overall return rate
Return rate among try-on users specifically
Revenue generated by try-on users
The measurement journey is straightforward: traffic drives try-on usage, try-on usage influences conversions, conversions generate revenue, and return rates help determine the final net value.
How to Measure Your Virtual Try-On ROI Accurately
Establish a Baseline
Prior to implementing virtual try-on, make sure to record your traffic, conversion rate, revenue, AOV, and return rate. If you skip this, you won't have anything to benchmark later.
Compare Results
After launch, track the same metrics again. Where you can, run an A/B test: one group sees the try-on feature, and a control group doesn't. Also account for outside factors that can distort your numbers:
Seasonal sales
Discounts or promotions running at the same time
General traffic changes
Product catalog changes
Marketing campaigns launched around the same period
Ignoring these factors can make it easy to attribute improvements to virtual try-on that may have been caused by something else.
Is Virtual Try-On Worth the Investment?
Virtual try-on is often a good option to test if there is a certain amount of website traffic and engagement on product pages; these products are often visually oriented, with fit and appearance being of concern, return costs are high, and there is sufficient order volume to confidently measure change.
The moral of the story is: don't base your judgment of virtual try-ons solely on the number of shoppers that click the button. Measure it by how it enables you to convert your existing traffic into valuable visits, increase revenue, reduce the blow of returns, and bring more return for your money than it costs.
If you're at that kind of store, you should give Mirrago a try, as it's a virtual try-on solution that's designed with fashion e-commerce in mind and can help you bridge the gap between browsing and buying with confidence.
Ready to Calculate Your Own Virtual Try-On ROI?
Every store's numbers will look a little different, and the only way to know your real ROI is to test it. Mirrago gives fashion brands a straightforward way to add virtual try-on and start tracking the conversion and return-rate impact for themselves.
Get Started with Mirrago →
Frequently Asked Questions
How do you calculate virtual try-on ROI?
Start with your baseline traffic, conversion rate, and return rate. After implementing virtual try-on, compare the same metrics, calculate the additional profit and return cost savings, subtract the tool's cost, then divide by that cost and multiply by 100.
Does virtual try-on increase e-commerce revenue?
It can, mainly by improving conversion on traffic you already have rather than by driving new visitors. The actual lift varies by store, so it's worth testing rather than assuming.
Can virtual try-on reduce return rates?
Often, yes, since it helps shoppers judge fit before buying. But watch total returned orders alongside the percentage, since higher order volume can offset some of that improvement.
What traffic and conversion metrics should I track?
Track website and product-page traffic, conversion rate, add-to-cart rate, average order value, revenue per visitor, and try-on-specific metrics like usage rate and try-on-to-purchase rate.
How can I tell if virtual try-on is worth the cost?
Compare the net financial gain, additional profit plus return cost savings, against what the tool costs to run. If the resulting ROI is positive and you have enough traffic to measure it reliably, it's generally worth the investment.